
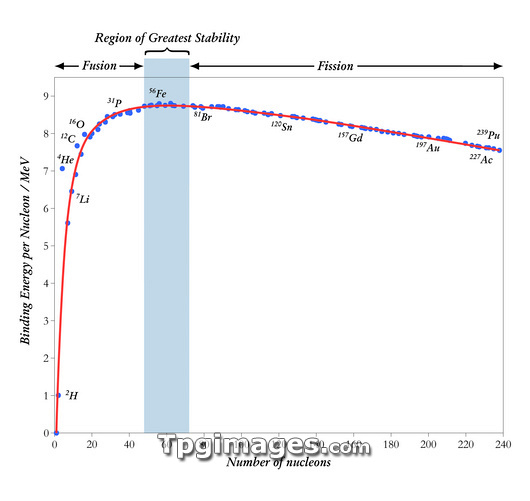
Graph of atomic nuclei binding energies (down left) plotted against the number of nucleons (protons and neutrons, across bottom) for the first 94 chemical elements (blue dots). Most of the elements follow a clear trend (red line), increasing in stability from hydrogen up to iron, the most stable element. This stability is because the strong nuclear force in the nucleus overcomes the electromagnetic repulsion between the protons. The stability then decreases as the nuclei get larger, resulting in unstable nuclei such as uranium and plutonium. In nuclear reactions, elements on the left of this graph undergo nuclear fusion (the nuclei combine), while elements on the right undergo nuclear fission (the nuclei split).
| px | px | dpi | = | cm | x | cm | = | MB |
Details
Creative#:
TOP03197342
Source:
達志影像
Authorization Type:
RM
Release Information:
須由TPG 完整授權
Model Release:
N/A
Property Release:
N/A
Right to Privacy:
No
Same folder images:
 Loading