
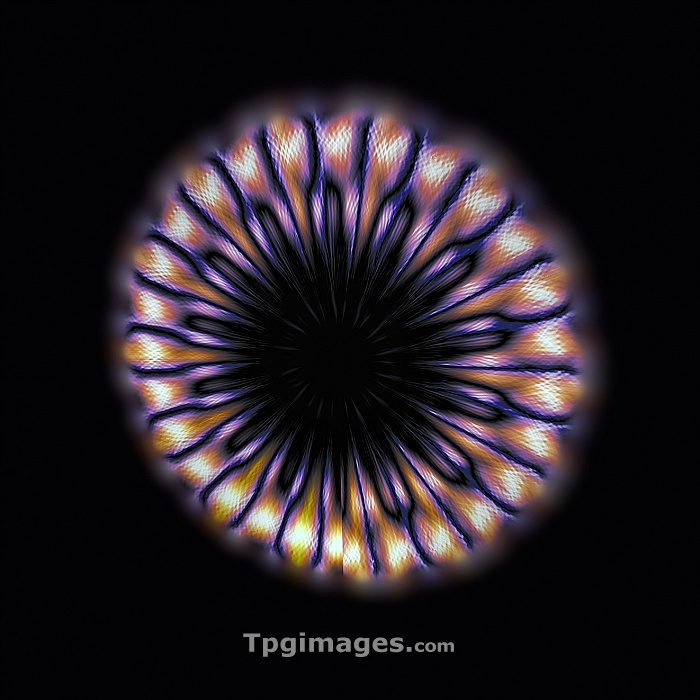
Humpback whale (Megaptera novaeangliae) song, wavelet graph. This image was produced by converting the sound frequencies of a humpback whale song into a graph using a mathematical process known as wavelets. Wavelets reveal structure and detail that are not always visible in standard graphs of frequency over time (known as a spectrogram). This image has been plotted as a polar coordinate (circular) graph but wavelet graphs can also be in rectangular form. Male humpback whales produce songs during mating season. They consist of a variety of low frequency moans and cries that are repeated over many hours. The songs, which can travel thousands of kilometres underwater, can be recorded using underwater hydrophones. Image created by Mark Fischer from Aguasonic Acoustics, USA.
| px | px | dpi | = | cm | x | cm | = | MB |
Details
Creative#:
TOP06662479
Source:
達志影像
Authorization Type:
RM
Release Information:
須由TPG 完整授權
Model Release:
NO
Property Release:
NO
Right to Privacy:
No
Same folder images:
 Loading