
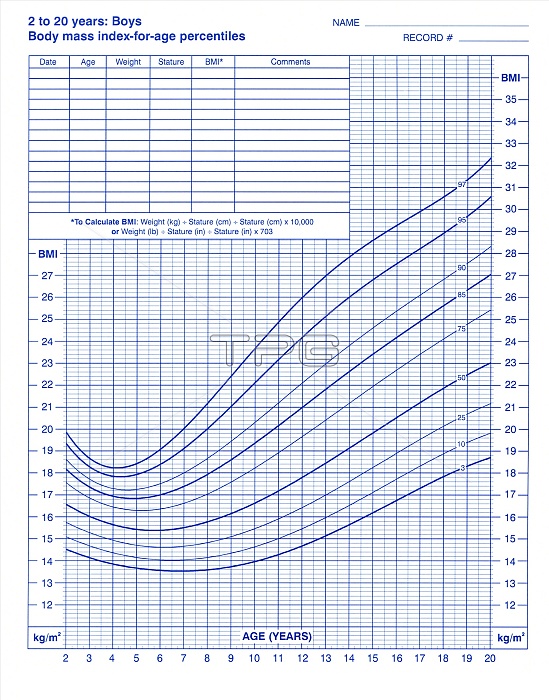
Body mass index chart (BMI). This is a body mass index-for-age chart for boys between 2 and 20 years old. BMI is a measurement of the weight of an individual comparative to their height. It is measured by taking the individuals weight and dividing it by their height squared and then multiplying that by a constant. The resulting number, when compared to age on this chart tells if the child is underweight, healthy, at risk of becoming overweight or overweight. The lines on this graph are percentile curves, if a child's BMI lies between the 85th and 95th percentile then 85-95 per cent of children have a lower BMI and the child is at risk of becoming overweight.
| px | px | dpi | = | cm | x | cm | = | MB |
Details
Creative#:
TOP10213508
Source:
達志影像
Authorization Type:
RM
Release Information:
須由TPG 完整授權
Model Release:
N/A
Property Release:
N/A
Right to Privacy:
No
Same folder images:
 Loading