
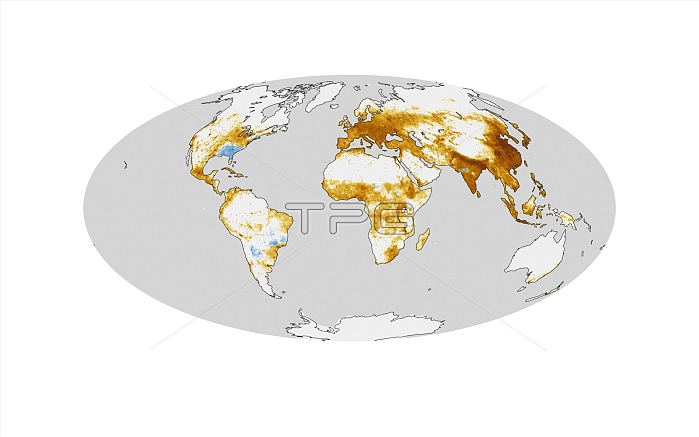
Global air pollution mortality levels. Computer model showing the estimated global variations in mortality levels due to air pollution. The colour-coding shows the estimated change in the number of premature deaths per year per 1000 square kilometres. The changes range on a logarithmic scale from minus 1000 (blue) to plus 1000 (orange). The model is based on the difference in pollution levels between 1850 and 2000. Fine particulate matter (PM2.5) has had a large impact in eastern China, northern India, and Europe, where urbanisation has added large quantities of PM2.5 to the atmosphere since the start of the Industrial Revolution. Image published in 2013.
| px | px | dpi | = | cm | x | cm | = | MB |
Details
Creative#:
TOP16633927
Source:
達志影像
Authorization Type:
RM
Release Information:
須由TPG 完整授權
Model Release:
N/A
Property Release:
N/A
Right to Privacy:
No
Same folder images:
 Loading