
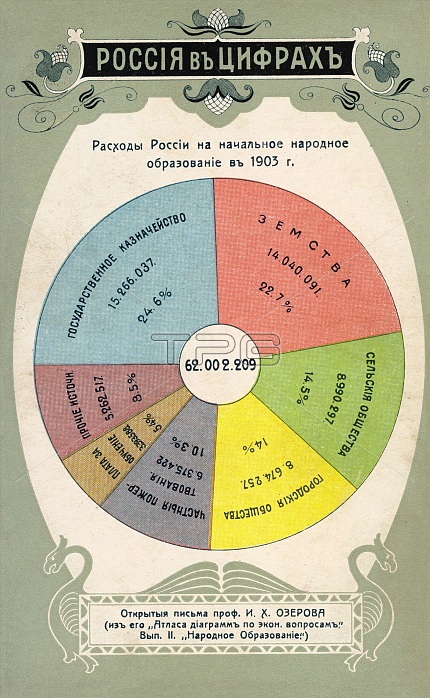
Statistics in the form of a pie chart giving details of spending on primary education in Russia in 1903, based on an economic atlas published by Professor I Kh Ozerov. The pink area represents Zemstva (similar to borough councils), green is rural areas, and yellow is urban.
| px | px | dpi | = | cm | x | cm | = | MB |
Details
Creative#:
TOP23760635
Source:
達志影像
Authorization Type:
RM
Release Information:
須由TPG 完整授權
Model Release:
No
Property Release:
No
Right to Privacy:
No
Same folder images:
 Loading