
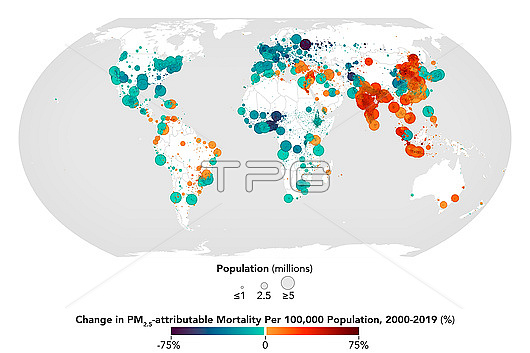
Global map showing changes in fine particulate matter (PM2.5) attributable mortality per 100,000 of the population from 2000-2019. Darker purple areas show a 75 percent decline in fine particulate matter attributable mortality whilst red areas show a 75 percent increase in fine particulate matter attributable mortality during this period. Fine particulate matter causes respiratory diseases, cardiovascular problems and premature death. Data obtained from two decades of NASA satellite data and health data from the Global Burden of Disease study by Institute for Health Metrics and Evaluation.
| px | px | dpi | = | cm | x | cm | = | MB |
Details
Creative#:
TOP27877119
Source:
達志影像
Authorization Type:
RM
Release Information:
須由TPG 完整授權
Model Release:
No
Property Release:
No
Right to Privacy:
No
Same folder images:
 Loading