
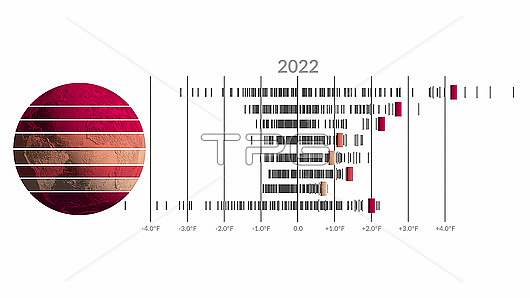
Graphics showing zonal surface temperature anomalies in 2022 in degrees Fahrenheit relative to a baseline period of 1951-1980. The latitude zones are 90N-64N, 64N-44N, 44N-24N, 24N-EQU, EQU-24S, 24S-44S, 44S-64S, 64S-90S. These data show that the Arctic is warming much faster than other regions of the planet. Scientists attribute this warming to increased carbon dioxide and other greenhouse gases in the atmosphere due to human activity.
| px | px | dpi | = | cm | x | cm | = | MB |
Details
Creative#:
TOP28868327
Source:
達志影像
Authorization Type:
RM
Release Information:
須由TPG 完整授權
Model Release:
n/a
Property Release:
n/a
Right to Privacy:
No
Same folder images:
artworkwhitebackgroundgraphiczonaltemperatureanomalies2022fahrenheitglobalearthworldglobenobodyclimatologyclimatechangeillustrationno-oneclimatologicalglobalwarmingabnormalanomalyantarcticantarcticaarcticartworkclimateearthobservationenvironmentenvironmentalgeographicalgeographysurfacemeteorologicalmeteorologymodeltemperatureanomalieswarmingworldwide21stcentury2000s2020slatitudelatitudeszones
2000s2020s202221stabnormalanomaliesanomaliesanomalyantarcticantarcticaarcticartworkartworkbackgroundcenturychangeclimateclimateclimatologicalclimatologyearthearthenvironmentenvironmentalfahrenheitgeographicalgeographyglobalglobalglobegraphicillustrationlatitudelatitudesmeteorologicalmeteorologymodelno-onenobodyobservationsurfacetemperaturetemperaturewarmingwarmingwhiteworldworldwidezonalzones
 Loading