
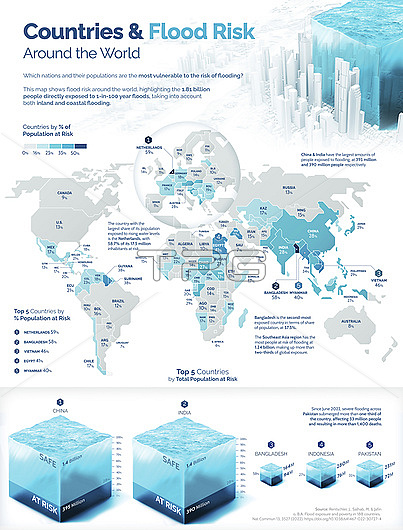
Infographic illustration showing the countries that have the highest percentage of their population at risk of 1-in-100 year floods. Both inland and coastal flood risks are included. This visualisation is based on data by Rentschler J, Salhab M and Jafino BA, Flood exposure and poverty in 188 countries, Nat Commun 13, 2022.
| px | px | dpi | = | cm | x | cm | = | MB |
Details
Creative#:
TPG34403483
Source:
達志影像
Authorization Type:
RF
Release Information:
須由TPG 完整授權
Model Release:
Not Available
Property Release:
Not Available
Right to Privacy:
No
Same folder images:
1-in-100yearcgichartclimatechangecoastalcountriescountrydangerdatadatavisualizationdigitallygeneratedenvironmentexposurefloodfloodinggeographicalgeographyglobalglobalwarminghumanimpactillustrationinfographicinfographicalinlandlabellabeledlabelledlabelsmapno-onenobodyone-in-onehundredyearpeoplepercentagepopulationrisktexttotalvisualisationvisualizationvulberablewaterwhitebackgroundworldworldwide
1-in-100backgroundcgichangechartclimatecoastalcountriescountrydangerdatadatadigitallyenvironmentexposurefloodfloodinggeneratedgeographicalgeographyglobalglobalhumanhundredillustrationimpactinfographicinfographicalinlandlabellabeledlabelledlabelsmapno-onenobodyone-in-onepeoplepercentagepopulationrisktexttotalvisualisationvisualizationvisualizationvulberablewarmingwaterwhiteworldworldwideyearyear
 Loading