
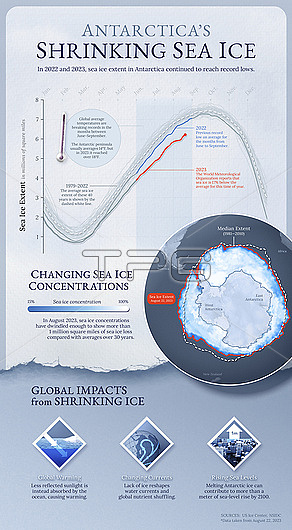
Shrinking sea ice in Antarctica, infographic illustration. At top is a graph of the monthly sea ice extent around the Antarctic. 2023 (red) was the lowest on record from months June to September compared to the average for this time of year. At centre right is sea ice extent, with 2023 in red and the median during the period of 1981-2010 shown by the dashed line. At bottom are some of the environmental impacts of sea ice loss.
| px | px | dpi | = | cm | x | cm | = | MB |
Details
Creative#:
TPG34966067
Source:
達志影像
Authorization Type:
RF
Release Information:
須由TPG 完整授權
Model Release:
N/A
Property Release:
N/A
Right to Privacy:
No
Same folder images:
 Loading