
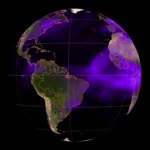
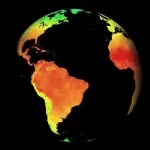
Earth磗 temperature variations over a year, from November 1st 2005 to November 1st 2006. Blue areas are coldest, through green and orange to red warmest. In the winter and spring the first part of the clip Canada and the northern USA are seen to be very cold, much colder than the equivalent latitude in Europe. This is due to the warming influence of the Gulf Stream in Europe. Data collected by AIRS, the Atmospheric Infrared Sounder, on board the Aqua spacecraft.


Details
WebID:
C00608472
Clip Type:
RM
Super High Res Size:
Duration:
000:16.000
Format:
QuickTime
Bit Rate:
25 fps
Available:
download
Comp:
150X150 (0.00 M)
Model Release:
NO
Property Release
No
 Loading