
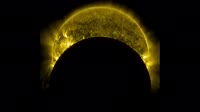
Solar magnetic field flipping. Animation showing the position of the sun's magnetic fields from January 1997 to December 2013. The magenta lines show where the Sun's overall magnetic field is negative, and the green lines show where it is positive. Additional grey lines represent areas of local magnetic variation. The entire Sun's magnetic polarity flips approximately every eleven years, defining what is known as the solar cycle. This visualization shows how in 1997, the positive polarity was at top, and the negative polarity at bottom. Over the next 16 years, each set of lines is seen to creep toward the opposite pole. By the end of the clip, the flip is almost complete. At the height of each magnetic flip, the sun goes through periods of more solar activity, during which there are more sunspots, and more eruptive events such as solar flares and coronal mass ejections (CMEs). The point in time with the most sunspots is called solar maximum.


Details
WebID:
C01787393
Clip Type:
RM
Super High Res Size:
1920X1080
Duration:
00:00:26.000
Format:
QuickTime
Bit Rate:
29 fps
Available:
download
Comp:
200X112 (0.00 M)
Model Release:
NO
Property Release
No
 Loading