
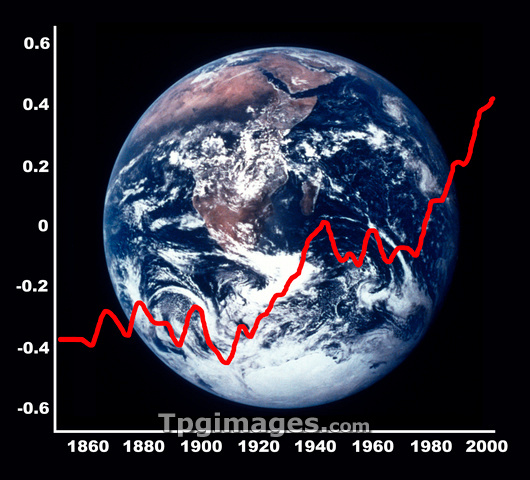
Global warming. Composite image of a graph of average global sea surface temperature (SST) change and the Earth. The graph shows the change in average temperature in C centrigrade between the years 1856 and 2000.
| px | px | dpi | = | cm | x | cm | = | MB |
Details
Creative#:
TOP03206304
Source:
達志影像
Authorization Type:
RM
Release Information:
須由TPG 完整授權
Model Release:
N/A
Property Release:
N/A
Right to Privacy:
No
Same folder images:
EARTHGRAPHPLANETANALYSINGSATELLITEIMAGEFROMSPACECOMPOSITEARTWORKSATELLITESPHERICALSPHEREGLOBEROUNDBALLCONCEPTUALILLUSTRATIONCONCEPTCONCEPTSEARTHSCIENCESCIENCESPHOTOPHOTOSIMAGEIMAGESGLOBALWARMINGCLIMATECHANGESURFACETEMPERATUREANALYSISRECORDRECORDEDNUMBERSYEARYEARS1860-2000ANNUALHEATTEMPERATUREAXISRECORDINGNUMBEREDDATEDATEDDATESWARMINGUPENVIRONMENTENVIRONMENTALCHARTCHARTINGDATAGLOBALMEANSURFACETEMPERATURESAVERAGERISERISING
1860-2000ANALYSINGANALYSISANNUALARTWORKAVERAGEAXISBALLCHANGECHARTCHARTINGCLIMATECOMPOSITECONCEPTCONCEPTSCONCEPTUALDATADATEDATEDDATESEARTHEARTHENVIRONMENTENVIRONMENTALFROMGLOBALGLOBALGLOBEGRAPHHEATILLUSTRATIONIMAGEIMAGEIMAGESMEANNUMBEREDNUMBERSPHOTOPHOTOSPLANETRECORDRECORDEDRECORDINGRISERISINGROUNDSATELLITESATELLITESCIENCESCIENCESSPACESPHERESPHERICALSURFACESURFACETEMPERATURETEMPERATURETEMPERATURESUPWARMINGWARMINGYEARYEARS
 Loading