
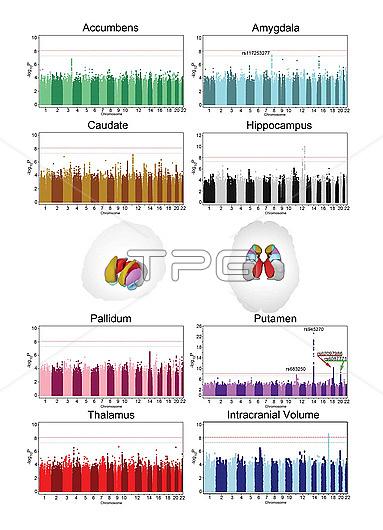
Charts showing genetic influences on brain structure. The charts are colour-coded to their respective brain structures shown at centre. The charts show the positions of genes (x-axis) and the evidence for association (y-axis) for each common genetic variant that influences brain volume.
| px | px | dpi | = | cm | x | cm | = | MB |
Details
Creative#:
TOP29217732
Source:
達志影像
Authorization Type:
RM
Release Information:
須由TPG 完整授權
Model Release:
Not Available
Property Release:
Not Available
Right to Privacy:
No
Same folder images:
accumbensamygdalaassociatenbiologicalbiologycaudatechartchromosomegeneticbasisgeneticlocigeneticlocusgeneticsgenome-wideassociationstudygraphgwashippocampusicvintracranialvolumelocationmanhattanplotsmorphometricneuroscienceno-onenobodypallidumputamenstructurethalamusvariationvisualisationvisualizationvolumewhitebackground
accumbensamygdalaassociatenassociationbackgroundbasisbiologicalbiologycaudatechartchromosomegeneticgeneticgeneticgeneticsgenome-widegraphgwashippocampusicvintracraniallocationlocilocusmanhattanmorphometricneuroscienceno-onenobodypallidumplotsputamenstructurestudythalamusvariationvisualisationvisualizationvolumevolumewhite
 Loading