
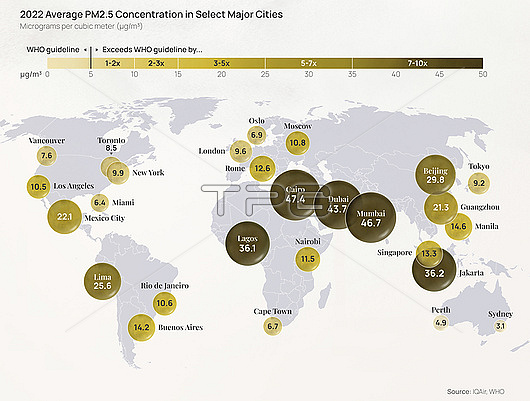
Infographic illustration showing air pollution in cities around the world in 2022. The pollution is measured as the average annual concentration of fine particulate matter less than 2.5 micrometres in diameter (PM2.5). The World Health Organization guidelines say that annual average concentrations of PM2.5 should not exceed 5 micrograms per cubic metre of air. This visualisation is based on data from the World Health Organization's IQAir World Air Quality Report (2022). For a version of this image with more text see F040/3519.
| px | px | dpi | = | cm | x | cm | = | MB |
Details
Creative#:
TPG34403470
Source:
達志影像
Authorization Type:
RF
Release Information:
須由TPG 完整授權
Model Release:
Not Available
Property Release:
Not Available
Right to Privacy:
No
Same folder images:
2.5micrometres2000s2020s202221stcenturyafricaafricanairpollutionairqualityasiaasiancgichartcitiescitydatadatavisualizationdigitallygeneratedenvironmentenvironmentaleuropeeuropeanfineillustrationinfographicinfographicallabellabeledlabelledlabelslatinamericalatinamericanmapno-onenobodynorthamericanorthamericanoceaniaparticulatematterpm2.5pollutedrespiratoryhealthsouthamericasouthamericantextvisualisationvisualization
2.52000s2020s202221stafricaafricanairairamericaamericaamericaamericanamericanamericanasiaasiancenturycgichartcitiescitydatadatadigitallyenvironmentenvironmentaleuropeeuropeanfinegeneratedhealthillustrationinfographicinfographicallabellabeledlabelledlabelslatinlatinmapmattermicrometresno-onenobodynorthnorthoceaniaparticulatepm2.5pollutedpollutionqualityrespiratorysouthsouthtextvisualisationvisualizationvisualization
 Loading